Order flow is the movement of orders in the market, reflecting the actions of buyers and sellers. It is a method of understanding the dynamics of price movement by observing the flow of orders in the market. These orders are submitted to the market through various methods, such as electronic trading platforms, phone calls to brokers, or physical trading pits. Understanding order flow is crucial to gaining insight into market trends, predicting future price movements, and making informed trading decisions.
This article will explore:
- The Basics of Order Flow.
- Why Order Flow Is Called a Catalyst for Volume Trade.
- Types Of Order Flow Charts.
- How Trade Prediction and Analysis Are Done Through Order Flow.
- What Data Is Visualized Using Order Flow Market.
- Order Flow as a Catalyst for Volume Trade
Order flow is considered a catalyst for volume trade due to its properties and characteristics. Firstly, order flow provides an indication of market sentiment, as it reflects the actions of market participants. For example, a sudden surge of buying orders indicates bullish sentiment, while a flurry of selling orders indicates bearish sentiment. This can lead to increased tradingvolume as more traders enter the market to take advantage of these trends.
Secondly, order flow provides liquidity to the market, as it reflects the willingness of traders to buy or sell assets at specific prices. This creates a dynamic market where prices are constantly adjusting to reflect supply and demand, which can lead to increased trading volume as traders seek to capitalize on price movements.
Another characteristic of order flow is its ability to provide traders with valuable information about the market’s liquidity. Liquidity refers to the ability to buy or sell an asset quickly and at a fair price. Order flow can help traders identify areas of high liquidity in the market, allowing them to execute trades with minimal slippage.
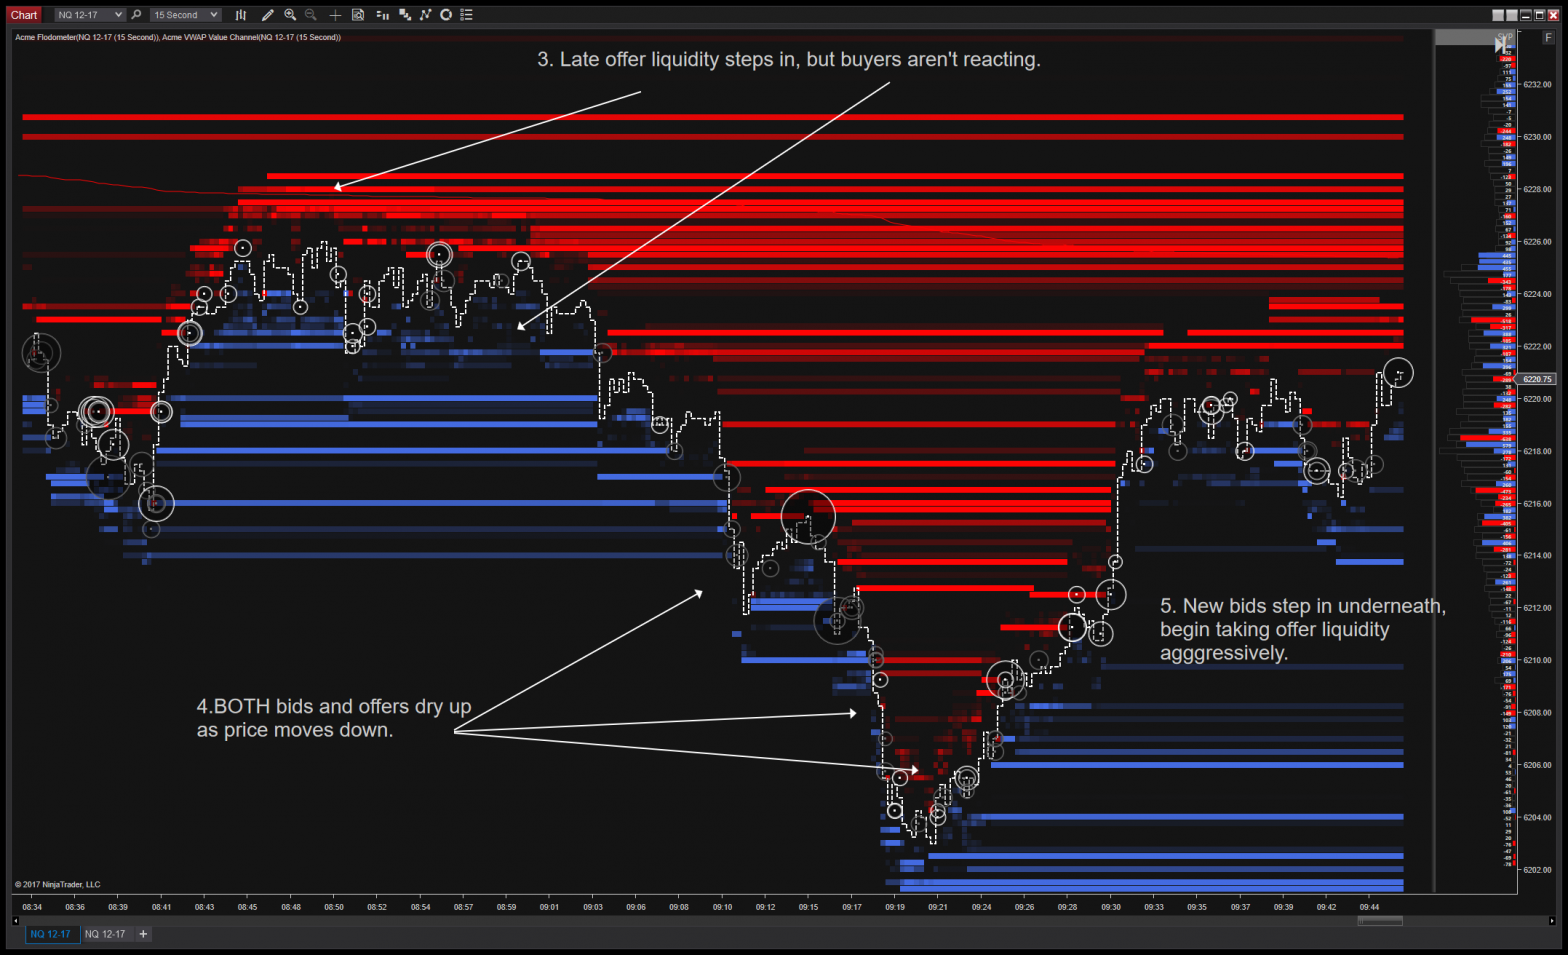
Types of Order Flow Charts
There are several types of order flow charts that traders can use to visualize order flow data. These include:
1. Time and Sales Charts: Time and sales charts provide a chronological record of each trade that occurs in the market. They display the price, size, and time of each trade, and can be used to identify trends and patterns in the market.
2. Footprint Charts: Footprint charts provide a visual representation of order flow data by showing the volume of trades at each price level. They are useful for identifying support and resistance levels, as well as market imbalances.
3. Cumulative Delta Charts: Cumulative delta charts show the net difference between buying and selling orders at each price level. They can be used to identify areas of strong buying or selling pressure, and to predict potential price movements.
How Trade Prediction and Analysis is Done Through Order Flow
Trade prediction and analysis can be done through order flow by understanding how to interpret the charts and make informed trading decisions. Here are some key steps for understanding, visualizing, and making decisions through the charts:
1. Identify areas of support and resistance: Use the order flow charts to identify areas where there is a high concentration of buying or selling activity. These areas are likely to act as support or resistance levels, and can provide traders with valuable information about the market’s direction.
2. Monitor market sentiment: Use the order flow charts to monitor market sentiment. Look for areas of high buying or selling volume, and use this information to gauge the strength and momentum of the trend.
3. Identify trading opportunities: Use the information gathered from the order flow charts to identify trading opportunities. Look for areas of support or resistance where the market is likely to reverse or continue in the same direction.
4. Manage risk: Use risk management techniques to minimize losses.
To understand and visualize order flow data, traders need to first understand how to read and interpret order flow charts. This involves identifying key support and resistance levels, analyzing volume and price data, and using technical indicators to identify potential entry and exit points.
For example, a trader may use a footprint chart to identify an area of strong buying pressure at a specific price level. They may then use a technical indicator, such as a moving average or trend line, to confirm the strength of this support level. Based on this analysis, the trader may decide to enter a long position, anticipating that prices will continue to rise as more buyers enter the market.
Similarly, a trader may use a cumulative delta chart to identify an area of strong selling pressure. They may then use technical analysis to identify potential resistance levels, such as a previous high or a trend line. Based on this analysis, the trader may decide to enter a short position, anticipating that prices will continue to fall as more sellers enter the market.
What Data is Visualized Using Order Flow Market
Order flow charts can be used to visualize a wide range of data, including:
1. Price data: Order flow charts can display the current market price, as well as historical price data, allowing traders to identify trends and patterns in the market.
2. Volume data: Order flow charts can display the volume of trades at each price level, allowing traders to identify areas of strong buying or selling pressure.
3. Order book data: Order flow charts can display the current state of the order book, showing the number of buy and sell orders at each price level.
4. Bid-ask spread data: Order flow charts can display the current bid-ask spread, which reflects the difference between the highest buy order and the lowest sell order.
Ready to start trading futures?
Call 1(800)454-9572 to speak with one of our experienced, Series-3 licensed futures brokers and start your futures trading journey on E-mini.com today.
Disclaimer – Trading Futures, Options on Futures, and retail off-exchange foreign currency transactions involves substantial risk of loss and is not suitable for all investors. Past performance is not indicative of future results. You should carefully consider whether trading is suitable for you in light of your circumstances, knowledge, and financial resources. You may lose all or more of your initial investment. Opinions, market data, and recommendations are subject to change at any time.